I thought these were pretty interesting:
flickr-yir-2015-top-cameras by Flickr Design, on Flickr
flickr-yir-2015-combo-camera-use by Flickr Design, on Flickr
Flickr Year in Review 2015 - Camera Brands by Flickr Design, on Flickr
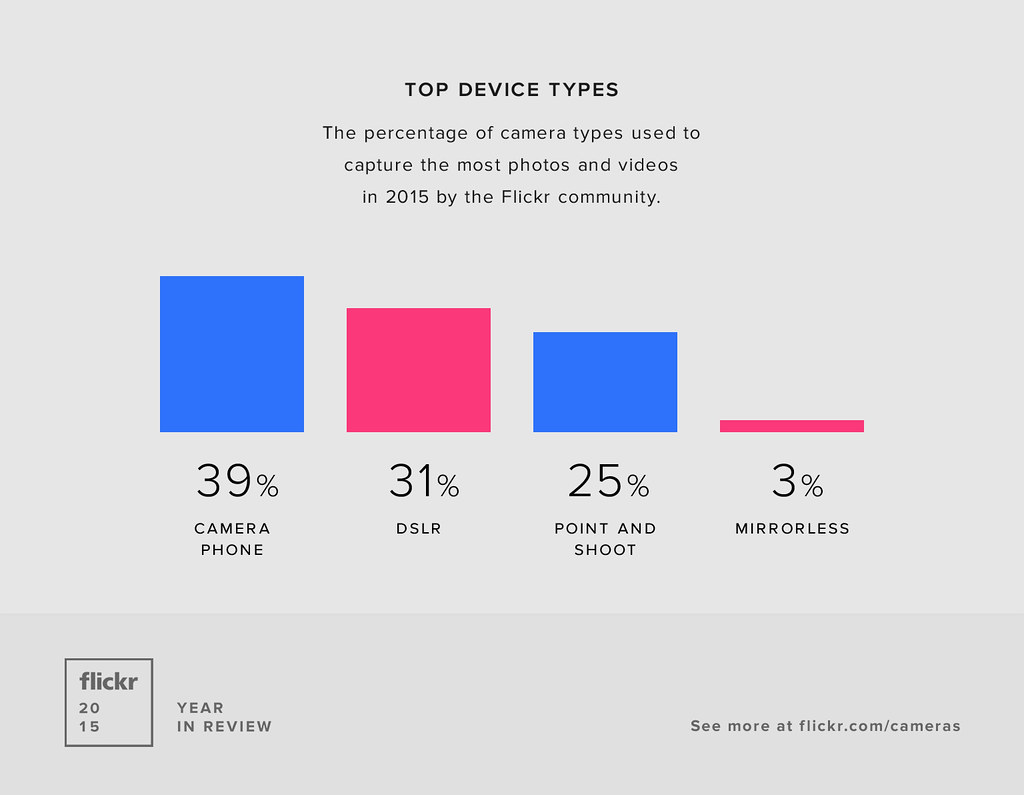
Flickr Year in Review 2015 - Camera Types by Flickr Design, on Flickr
Numbers are always fun.

 Reply With Quote